
How to Mine Ecommerce Insights from Analytics
If you run an ecommerce business, chances are you’ve set up Google Analytics for the promise of meaningful insights to grow your sales.
But many business owners grossly underuse their ecommerce analytics,
falling into the trap of leaving money on the table or making “improvements” that hurt more than they help.
Let’s make that data less daunting so you can start harnessing it to make informed decisions about your growth.
Here’s how you can uncover valuable ecommerce insights and start turning analytics into action—
without costly software or a data science degree.
- Two reasons people struggle with ecommerce analytics
- How to start with good questions to get good answers
- Where to look for ecommerce insights and how to turn answers into action
- Website insight example
- Marketing insight example
- Product insight example
- What good questions will you ask your analytics?
Two reasons people struggle with ecommerce analytics
There are two common pitfalls that prevent companies from leveraging analytics to meaningfully grow their business:
- Assuming that a tool like Google Analytics will automatically track and communicate everything important right out of the box.
- Analyzing data only at a superficial level, expecting specific answers from high-level metrics like overall traffic to the site or average engagement time.

The result is making business decisions based on an incomplete picture or, worse, becoming data-dismissive instead of data-driven because you’re struggling to find deep ecommerce insights in the shallow end of your analytics.
So let’s demystify ecommerce analytics with use cases and best practices courtesy of Daniel Patricio, the data-driven owner of Bull & Cleaver, a company that sells authentic biltong—a South African favorite meat snack that’s “better than traditional beef jerky.”
How to start with good questions to get good answers
According to Patricio, “There’s no such thing as a single source of truth for all your answers. Different views into your analytics will answer different questions. So the most important question to start with is, ‘What are you actually trying to answer?’”
What specifically do you want to know about your website, marketing, customers, or products and, more importantly, what will you do with the answer?
A single good question can lead to an answer that leads to more questions that lead to even more answers—rabbit holes pop up naturally when you start digging into your analytics. Without a question as a starting point, though, you’re left wading through your data analysis without a direction, which wastes time when you have a dozen other things to do to grow your business.
Examples of good questions to ask can range from:
- How has traffic to our landing pages changed over time?
- How many visitors add an item to their cart without checking out?
- Where am I losing most people in the checkout process?
- How likely to purchase are visitors from social media campaigns compared to visitors from email campaigns?
- Did adding that pop-up to your website two months ago help or hurt conversions?
- How are visitors behaving on our shop page?
- What can we learn from our product pages?
- What was the return on investment of my Google Ads campaign last month?
The good news is that the latest version of Google Analytics—a popular free analytics platform and one you’ll likely be using—makes it easier to find and digest insights, compare behavior between different segments of your audience, and customize reports and actionable data explorations.
For many basic insights—like how many conversions were generated by organic search versus paid search, or what are the top domains sending referral traffic to your site this quarter—you can even type what you’re looking for in the search bar to get a quick answer from Analytics Intelligence before diving in deeper.

By default, reports in Google Analytics are based on all users on your site, but by clicking Edit comparisons you can also compare multiple segments of audiences across a variety of dimensions, such as “users who made a purchase” and “users who added to cart without purchasing” to look for patterns that may make a user more likely to complete their purchase.

Depending on your setup, however, your out-of-the-box analytics tool may be insufficient for finding more granular insights and may require some customization, looking in a separate platform like your Shopify store, or even setting up a new analytics tool entirely.
Common scenarios for expanding your analytics for answers include:
- Enabling enhanced ecommerce tracking in Google Analytics so you can track individual stages (like product views, add to cart, etc.) in the purchasing process for specific products
- Creating custom events in Google Analytics to track micro-conversions such as newsletter signups
- Customizing your columns in your Facebook Ads Manager so you can measure the frequency your audience is seeing your ads or the cost per page like
- Generating a custom report in Shopify to analyze which products your customers are returning the most often
- Implementing heat maps through a tool likeHotjar orLucky Orange (Shopify app) to analyze browsing behavior on your product pages to see what sections are capturing their curiosity
Where to look for ecommerce insights and how to turn answers into action
According to Patricio, there are two jobs data can have:
- Business management—supporting decisions about reinvesting in your business, replenishing inventory, refining your website’s messaging, etc.
- Channel optimization—supporting decisions for specific channels about where to allocate your budget, which ads to scale, what audiences or tactics to double down on, etc.
“People make the mistake of using the same tool to do both jobs. If you’re looking at Facebook, Google, or your email marketing platform, they each want you to believe that their measurement tools are the source of truth for everything, but they aren’t, nor should they be.”
He uses Facebook to illustrate: “You can trust Facebook for their click-through rates, frequency of your ads displaying, how people are reacting to them, and which ones are getting good feedback. But if you’re trying to measure what happens after they land on your site or purchases based on the impact of your Facebook ads, you might get a less useful answer.” Patricio says this is especially true as privacy changes make attribution more difficult.
That’s why Patricio divides ecommerce insights into three buckets:
- Website insights are based on how people behave after landing on the site, and what they click on, spend time on, fill out, and scroll past.
- Marketing insights are based on how people interact with your various marketing channels and tactics, from social media ads to abandoned cart emails to sponsored posts.
- Product insights are based on product sales and inventory across your catalog.
To help guide you in your own digging, here are real examples of each type of insight, from question to answer to the action it inspired to help Bull & Cleaver make decisions both big and small.
Notice that sometimes where you start with your question is not always where you end up finding your answer.
Website insights from “How are visitors behaving on my /shop page?”
With so many different flavors of biltong, a natural source of friction on the path to purchase is deciding which one to try first.
Patricio’s solution was a taster pack for first-time customers to sample his most popular products.
It was so effective at converting customers that he decided to roll that insight out across his business, prioritizing these bundles above the rest of his catalog at the top of his /shop page.
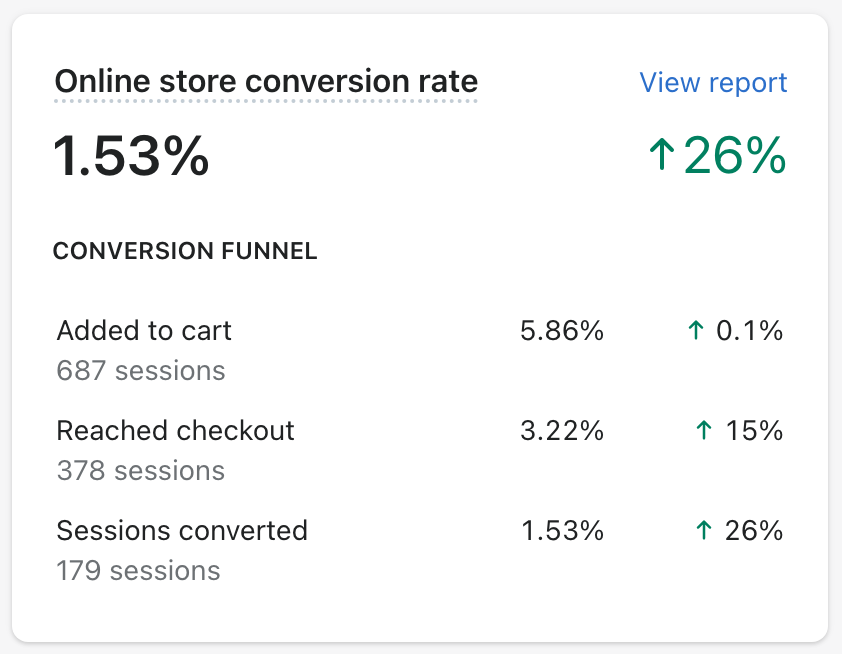
Google Analytics showed traffic to the page was fine but conversions were down. So he looked at a heat map tool instead to see where visitor attention and clicks were going.
What he found was people were skipping the bundles and scrolling down. Once he saw the data, it seemed obvious—shoppers would want to know more about the individual products first before purchasing a bundle.
He was able to course-correct thanks to this feedback loop, move the taster bundles further down, and improve the conversion rate on the /shop page by nearly 20%.

Marketing insights from “How has traffic to our landing pages changed over time?”
When you have so many moving parts across your business, it becomes increasingly important to monitor how optimizing in one area can affect another. When Patricio realized how powerful the taster pack was for converting first-time purchasers, he decided to experiment with sending more traffic to that page.
“Most of our sales were coming from our homepage, Traditional Biltong page, and Droewors page. We levelled those down in priority to send more traffic to the taster packs, which are really popular for first-time purchasers.”
It’s easier to experiment confidently like this when you can monitor the trade-offs and downstream effects over time of significant decisions like redistributing your traffic in this manner. If there turns out to be a negative impact of some kind, analytics can act as a tripwire.

This graph from Bull & Cleaver’s Google Data Studio dashboard shows the flow of traffic being redistributed from other pages to the taster pack page over time.
Product insights from “Why was average order value for returning customers at an all-time low last week?”
A number of explanations can exist for why a healthy metric randomly falls well below expectations, like in the case of Bull & Cleaver’s average order value for returning customers.
The drop was obvious, but was it a change in the marketing strategy, the website itself, or just seasonal demand?
Turns out it was just a sold-out product.
“The first time I saw that average order value really going down,
what I didn’t realize from looking at the website analytics was that the sales contribution
to AOV from our biltong slabs was what had actually gone down,” says Patricio.
They were out of stock of that key product because they were planning to expand the product line before relaunching it.
It’s easy to jump to conclusions based on the performance of a single metric,
so it’s important to ask what other related metrics could be influencing it too?
In the case of AOV, it’s individual product sales.
He ended up creating a simple spreadsheet to get to the root cause
and noticed sales of his slabs had gone down to almost zero.
Percentage of total sales by product type from March to April
- Bulk: 45.88% → 34.57%
- Bundle: 32.61% → 44.57
- Slab: 9.45% → 0.69%
- Snack: 12.06% → 20.18%

The sold-out product had actually brought down a lot of averages,
but average order value for returning customers took the biggest hit.
This insight it led to was that the product was in demand, especially with existing customers,
and so he should work to expand the product category.
This has Patricio excited to relaunch his slabs soon because he’s managed to get his sales back on track
without it and can only imagine the big boost in sales and retention the relaunch will create.
What good questions will you ask your analytics?
Ecommerce analytics can be overwhelming at first, and no one becomes data literate overnight.
But over time, question after question and answer after answer,
you can learn how to be curious about different areas of your business and where to look for answers.
The best place to start is by setting up Google Analytics for your Shopify store.
Read More
- How to Make Your First Online Sale in 30 Days (Checklist)
- Google Analytics for Ecommerce in 2022 (Complete Guide)
- How To Use Ecommerce Analytics For Your Online Store
- What Chatbots Can (and Can’t) Do for Your Online Store
- 14 Call to Action Examples (and How to Write an Effective CTA)
- How to Dramatically Improve Your Conversion Rates in 2015 Using These 3 Analytics Reports
- 9 Google Analytics Custom Reports by the Experts (and How to Use Them)
- 5 Psychological Design Tactics that Make Brains Tick and Visitors Click
- 6 Must-Have Shopify Apps for the Era of Conversational Commerce
- The Psychology of Persuasion- How to Sell Like an FBI Hostage Negotiator


Responses