
68 Useful eCommerce Statistics
Have you been looking for eCommerce statistics to use to help grow your business online?
If you’re selling products online, it’s important to know the facts about eCommerce so you can check in with your website and make any necessary changes.
In this list, we’ve rounded up the most amazing eCommerce statistics you must know for 2022.
Here’s a table of contents of the post for easy navigation:
- General eCommerce Statistics
- Email eCommerce Statistics
- Social Media eCommerce Statistics
- Mobile eCommerce Statistics
- Shopping Cart eCommerce Statistics
How Many eCommerce Sites Are There in 2022?
There are an estimated 12 million – 24 million eCommerce sites across the entire globe, with more and more being created every single day.
If these numbers make you think it’s a competitive market — don’t worry. Less than 1M of these sites sell more than $1,000/year, so there’s tons of room for growth.
And as building your own website becomes easier for everyone, having an eCommerce store is becoming a popular way for more people to make money online.
So now that you have an idea of the size of the eCommerce industry (and how many people are making money with it) let’s take a look at some important eCommerce facts and stats.
eCommerce Statistics You Must Know in 2022
The growth of eCommerce is absolutely astounding and it’s not slowing down any time soon, as the stats in this post will prove.
You’ll want to take what you learn from the data and find some ways to apply it to your own small business.
So without further ado, let’s take a look at some eCommerce statistics you must know.
General eCommerce Statistics
Simply put, eCommerce is commercial transactions that take place electronically online.
And by the year 2022, eCommerce is expected to generate $5.42 trillion in sales per year.
If you’re thinking the future looks bright for those selling products online, these stats definitely back that up.
- Firstly, 61% of online consumers in the United States have made a purchase based on recommendations from a blog. (Content Marketing Institute)
- Secondly, 59% of Millennials will go to Amazon first when online shopping, making the giant online retailer one of your biggest competitors. (Inviqa)
- Thirdly, By the year 2040, it’s estimated that 95% of all purchases will be through eCommerce. (Nasdaq)
- In 2017, Amazon accounted for 44% of all US eCommerce sales. (CNBC)
-
55% of online shoppers tell friends and family when dissatisfied with a product or company. (UPS)
- 93.5% of global internet users have purchased products online. (OptinMonster)
- Around 50% of people say they’d purchase something from a website’s chatbot using conversational marketing. (Drift)
- 76% of people prefer to go to a physical store for holiday shopping. (GeoMarketing)
- Multi-step forms in WordPress can lead to 300% more conversions. (Venture Harbour)
- The eCommerce industry is growing 23% year-over-year, yet 46% of American small businesses still don’t have a website. (BigCommerce)
- Globally, credit cards are the preferred method of payment, being used in 53% of transactions, followed by digital payment systems (43%), and debit cards (38%). (Kinsta)
- 68% of small businesses don’t have a structured or documented conversion rate optimization (CRO) strategy. (State of Conversion Optimization Report)
- Mobile shopping hit $2 billion for the first time on Cyber Monday in 2017. (Practical eCommerce)
- 69% of B2B businesses say they expect to stop printing catalogs within 5 years. (B2XPartners)
- Amazon is making an AI-based, real-time product recommendation engine available to sellers who use the AWS console. (Absolunet)
- 32% of online shoppers own at least one connected home device. (UPS)
- Only 2.86% of eCommerce website visits convert into a purchase. (Invesp)
- In the US, 2 in 5 consumers (41%) receive 1-2 packages from Amazon per week and that number jumps to 50% for consumers ages 18-25, and 57% for consumers ages 26-35. (Walker Sands)
- The #1 reason people shop online is that they’re able to shop at all hours of the day. (KPMG)
- In the last year, businesses have lost $756 billion because of poor eCommerce personalization. (OptinMonster)
- 6 out of 10 American shoppers use self-service tools for their concerns including websites (24%), mobile apps (14%), voice response systems and VoIP (13%) or online live chat (12%). (Amex)
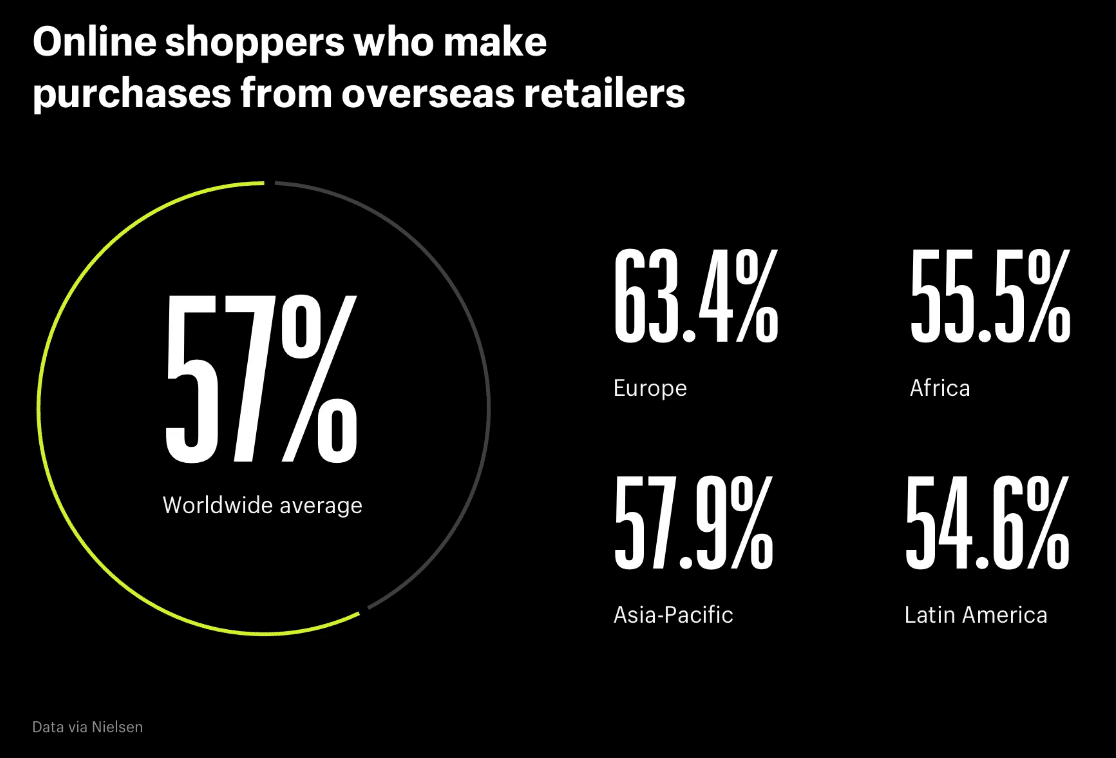
- Globally, 57% of online shoppers buy from retailers who are overseas. (Nielsen)
Email eCommerce Statistics
Email has the highest ROI out of all other marketing campaigns, so using it is super important to growing your business online. It’s a fantastic tool to use to generate leads and nurture customer relationships. If you aren’t already using email marketing, make sure to check out this post on the best email marketing services to find one that works for you.
- Firstly, The biggest reason the B2B eCommerce market see success in their email campaigns is because they provide compelling content for each stage of the customer journey. (B2B Marketing Community)
- Secondly, 61% of consumers prefer to be contacted by brands via email. (Statista)
- Thirdly, Email marketing yields $44 for each $1 spent for a 4400% ROI. (OptinMonster)
- 58% of the top 1,000 US online retailers send welcome emails. (Smart Insights)
- Segmented campaigns to email subscribers drive a 760% increase in revenue. (Campaign Monitor)
- Email marketing was responsible for 24% of holiday sales during the 2018 holiday eCommerce season. (OptinMonster)
- Nonprofits lose about $15k/year in donations due to spam filters blocking fundraising campaign emails. (Philanthropy.com)
- Transactional emails get 8x more opens and clicks than any other type of email campaign and make 6x the money. (Experian)
- Email marketing contributes to 20% of traffic driving eCommerce sales. (Wolfgang Digital)
- 60% of consumers say they’ve made a purchase as the result of an email marketing message they received. (OptinMonster)
- Abandoned cart emails have an average open rate of 45%. (Moosend)

We’ve got even more email marketing statistics for you to check out if you want to see more.
Social Media eCommerce Statistics
Your brand can see a huge boost in profits if you include social media in your digital marketing strategy. And it’s one of the very best ways to use the powerful psychological phenomenon of social proof to make more money online and grow your site. Love it or hate it on a personal level, social media is a digital communication strategy that deserves your attention if you run an eCommerce website or any business online.
- Firstly, 25% of US shoppers consult social media before buying a gift for friends and family. (nChannel)
- Secondly, Online stores with a social media presence have an average of 32% more sales than those that don’t. (BigCommerce)
- Thirdly, The average eCommerce site publishes 4.55 posts a week on their Facebook page. (BigCommerce)
- 74% of consumers rely on their social networks to make purchasing decisions. (Kinsta)
- 85% of orders from social media sites come from Facebook. (Shopify)
- The number of marketers sharing video content on LinkedIn rose to 65% in 2021. (DreamGrow)
- Posts with photos get 53% more Likes, 104% more comments, and 84% higher click-through rates. (Neil Patel)
- 75% of Instagram users have taken an action, such as visiting a website, after looking at an Instagram advertising post. (Locowise)
- The average order value for customers referred from Instagram is $65.00, followed by Facebook ($55), Twitter ($46), and YouTube ($38). (Shopify)
- Social media posts with 80 characters or less get 66% more engagement. (Neil Patel)
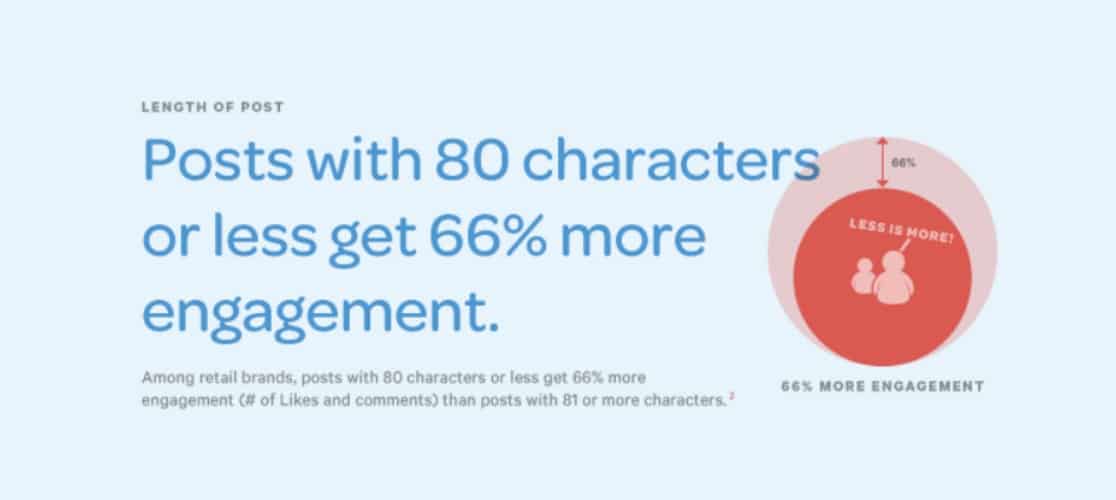
Source: Neil Patel
Mobile eCommerce Statistics
If you want a successful eCommerce website, you should look into mobile optimization. Not spending time focusing on mCommerce is basically ignoring the majority of your potential customers. The following mobile eCommerce stats should give you a better idea as to why.
- Firstly, 93% of Millennials have compared online deals using a mobile device. (Statista)
- Secondly, 40% of all online purchases made during the holiday season are done on smartphones. (OuterBox)
- Thirdly, 65% of consumers look up price comparisons on mobile while in a physical store. (KPMG)
- 32% of shoppers changed their minds about purchasing items after checking out product information on their mobile devices within a physical store. (Invesp)
- 82% of Internet users in the United States have used a mobile device to shop online. (Statista)
- Conversion rates from mobile apps are 3x higher than mobile websites. (Marketing Land)
- 73% of consumers will switch from a poorly designed mobile site to one that makes purchasing easier. (Google)
- 53% of smartphone and tablet owners will shop on company-specific apps. (Invesp)
- People who have a negative experience in your mobile store are 62% less likely to purchase from you in the future. (Google)
- 90% of the time spent on mobile devices is spent within apps. (Flurry Analytics)
- Making CTA buttons (like a Click-To-Call button) can create a 45% boost in clicks. (CopyBlogger)
- If page loading times change from 1 second to 3 seconds, bounce rates on mobile sites increase 32%. (Google)
- Sales from mCommerce on both Black Friday and Cyber Monday in 2018 were more than $2 billion, breaking the previous records set the year before. (Practical eCommerce)
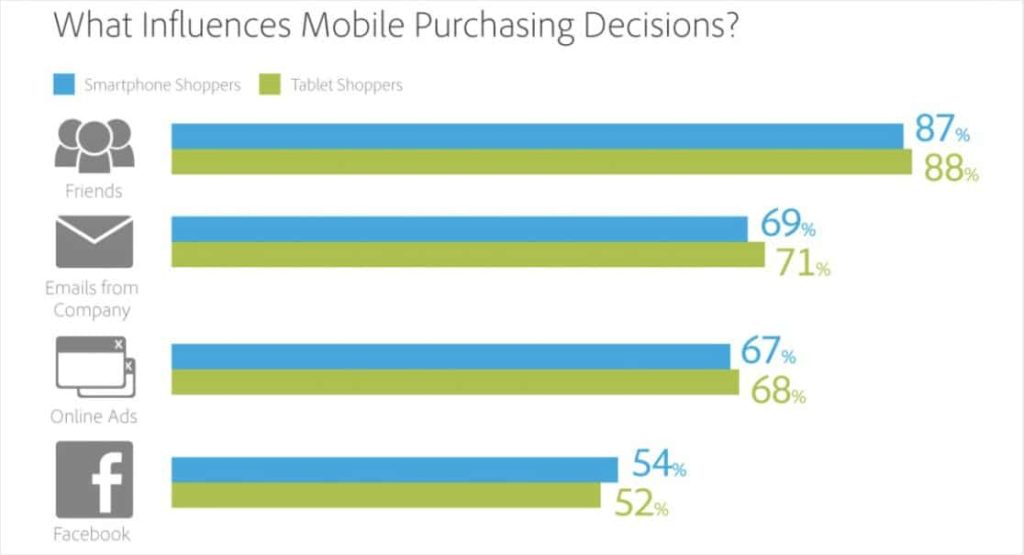
- People’s friends have the most influence on mobile purchasing decisions over email marketing, online ads, or Facebook. (Adobe)

Source: Adobe
Shopping Cart eCommerce Statistics
The online shopping cart is where a lot of the action happens for your customers. It’s the last step before that purchase is finally made, and there’s been 100s of studies surrounding shopping cart eCommerce statistics since it’s such an important stage of your digital sales funnel. One theme in these stats is for sure — cart abandonment hurts your bottom line.
- Firstly, 46.5% of small to mid-sized businesses say that offering free shipping increases their profits. (MCM)
- Secondly, If you require account creation during the checkout process, 23% of people will abandon carts immediately. (Baymard Institute)
- Thirdly, The average cart abandonment rate across all industries is 69.89%. (Baymard Institute)
- Exit-Intent popups have helped recover 53% of abandoning visitors. (OptinMonster)
- Slow-loading sites increase the abandonment rate by 75%. (Baymard Institute)
- The product with the highest abandonment rate is clothing (40%), followed by tech (18%), and home products (16%). (OptinMonster)
- eCommerce sites can gain a 35% increase in conversion rates with an optimized checkout design. (Baymard Institute)
- At the average abandonment rate of nearly 70%, eCommerce sites could be losing a total of $3 billion a year. (Disruptive Advertising)
- Mobile has the worst cart abandonment rate of all devices at 78%, followed by tablets (70%), and desktops/laptops (67%). (OptinMonster)
- The biggest reason for shopping cart abandonment is extra costs that are too high. (Baymard Institute)
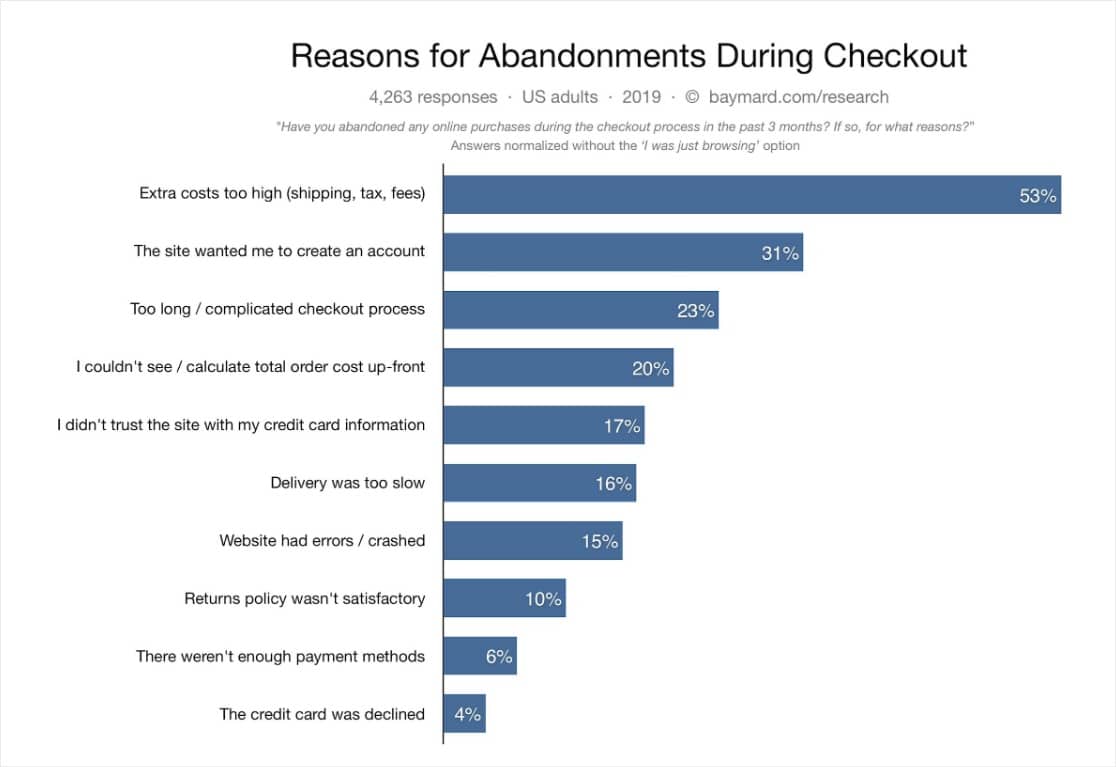


Responses